Navigation and shortcuts
User interface elements
Analyzer user interface is divided into four areas.
- Toolbar
- Data area
- Side bar
- Status bar
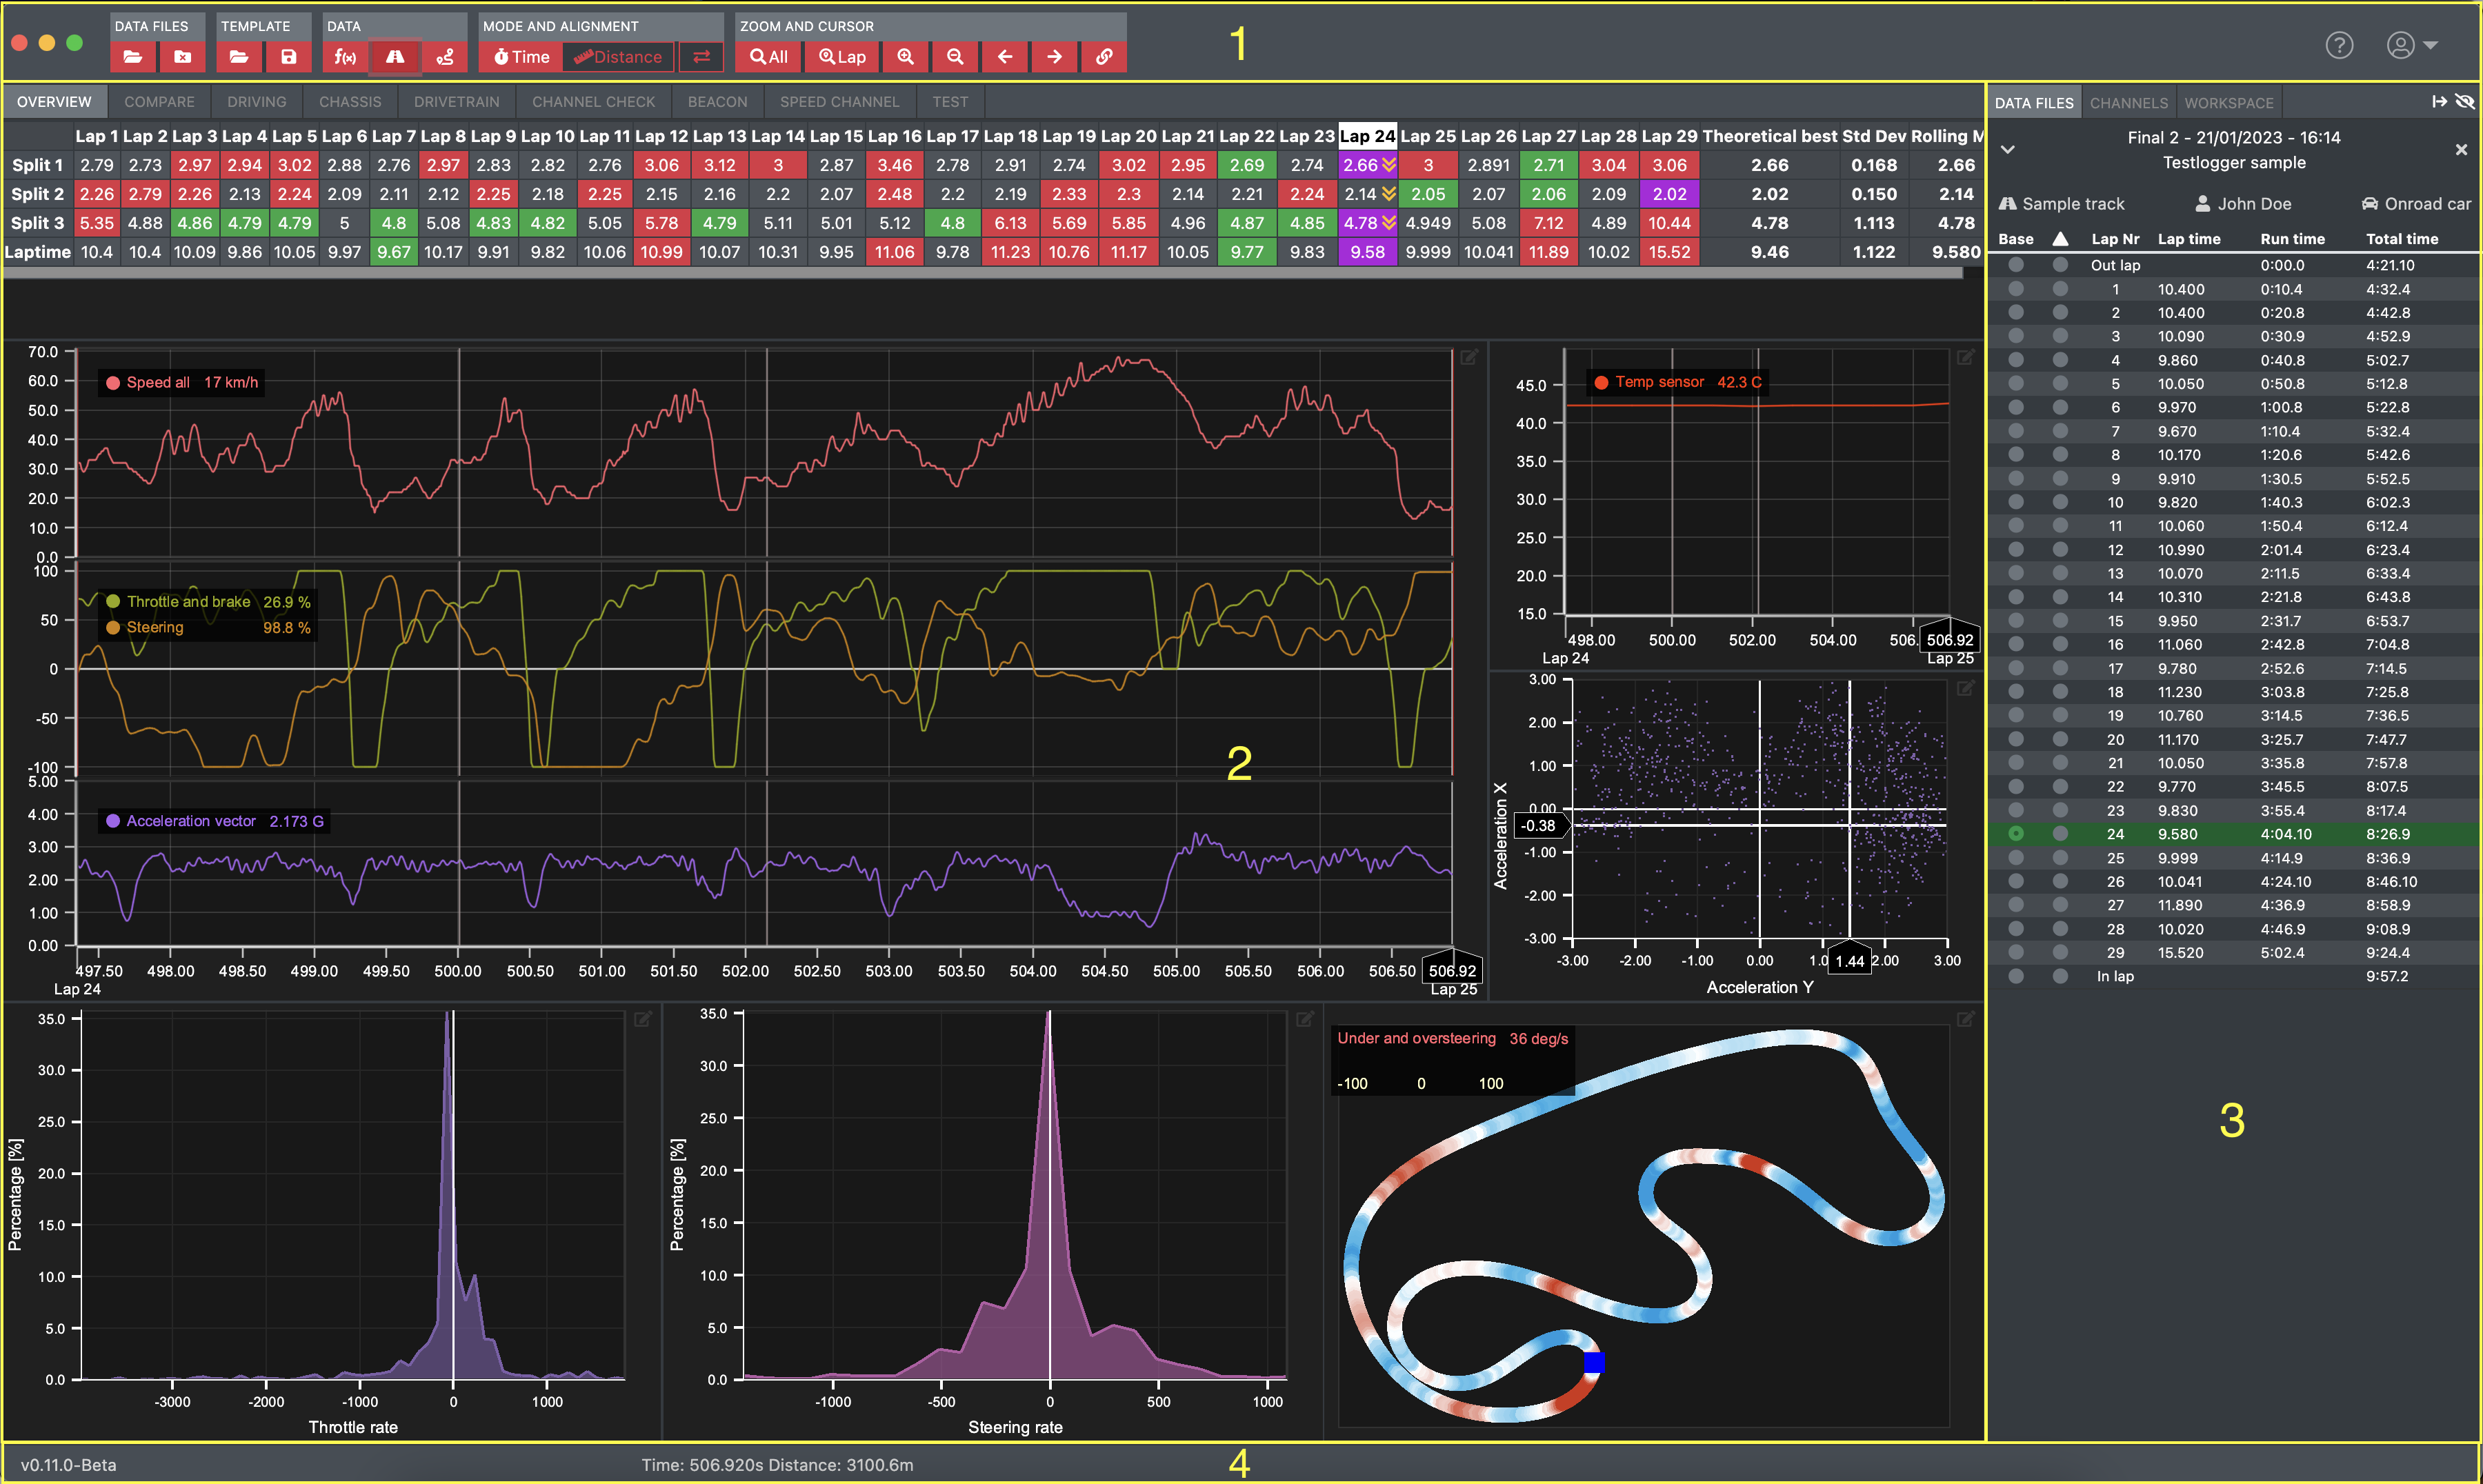
Toolbar
Toolbar is used to access other Analyzer functions and changing the data zoom and visibility.

- Open data file browser. Data stored either locally or in Testlogger Manager are opened with this dialog
- Close all open data files
- Open workspace
- Save workspace as file
- Math channel editor
- Track generator
- Lap/split editor
- Video importer
- Switch to show data either in function of time or in function of distance
- Activate comparison file offset possibility
- Zoom out to show whole data file
- Zoom to currently active lap
- Zoom in
- Zoom out
- Pan data to left
- Pan data to right
- Toggle Delta marker
- Open Analyzer knowledge base in browser
- User menu (e.g. application settings, user settings)
Data area
Data area is used to show the actual data from files based on the workspace settings. Tabs can be utilised to create different views. Read more about it from Workspace page.
Info
Data area can be expanded vertically outside the screen view.
Side bar
Side bar is used to show open data files, channel listing and workspace modules.
Info
Side bar can be reduced or hidden from the buttons on right hand side of tabs.
Data files tab shows opened files and their relevant details.
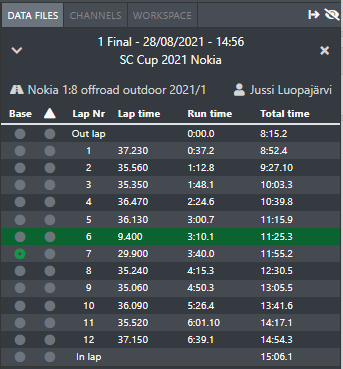
Each row has base and compare radio buttons, lap number, lap time, run time and total running time. Header shows files name, date, time and session. Also track, car and driver is shown if present in the files metadata. Fastest lap is highlighted.
Info
Close file by clicking the X button in the top right corner.__ADMON_END__
__ADMON_BEGIN__info____
Run content can be minimized with  button or by pressing h.
Info
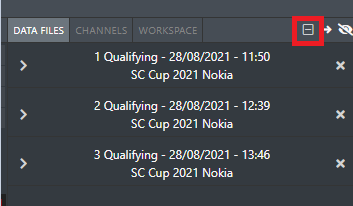
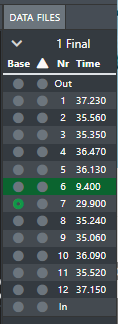
All runs can be collapsed with the collapse all button or from the runs arrow button. Runs can be reordered by dragging them from the title header.
Channel listing tab shows all base files data channels categorized based on channels type.
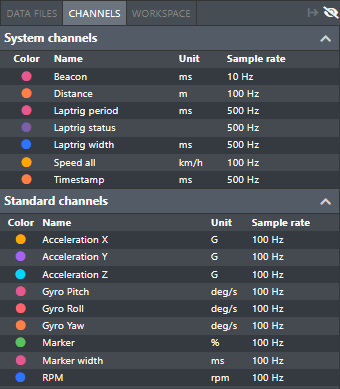
Each row has channels colour, name, unit and channels sampling rate.
Info
Channel colour can be changed by clicking the colour circle.
Info
Channels can be drag and dropped to chart elements.
Channel categories
| Category | Definition |
|---|---|
| System channels | Important system channels to keep the system working |
| Standard channels | All other logged channels |
| Math channels | System and user defined math channels. |
| Debugging channels | Channels used for system debugging (hidden by default). |
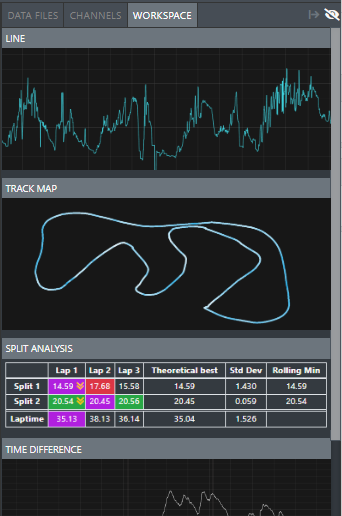
Workspace tab shows available chart elements. See chart element descriptions in Workspace.
Info
Workspace editor mode is activated when tab is changed to Workspace.
Info
Drag and drop or double click to include charts in the chart area.
Status bar
Status bar currently show application version, cursor position (time and distance and delta values) and status messages.
Keyboard shortcuts
| Key | Action |
|---|---|
| e | Toggle workspace edit mode tab |
| d | Toggle data files tab |
| c | Toggle channels tab |
| Ctrl+oCmd+o | Open data file browser |
| h | Minimize run content side bar |
| Ctrl+hCmd+h | Hide/show side bar |
| Ctrl+lCmd+l | Open lap editor |
| Ctrl+vCmd+v | Open video importer |
| Ctrl+mCmd+m | Open math channel editor |
| Ctrl+tCmd+t | Open track map generator |
| Ctrl+xCmd+x | Close all data files |
| a | Zoom out to show whole file |
| s | Zoom to cursors hovered lap |
| Left arrow | Pan file to left |
| Right arrow | Pan file to right |
| Up arrow | Zoom in |
| Down arrow | Zoom out |
| Space | Place marker or remove marker |
Lap selection
- Select main lap you want to analyse by selecting the radio button on lap list
- Select lap to compare to with the second radio button
- Remove comparison lap by clicking the white radio button
- Reset base lap zoom by clicking the green radio button
Data mode and alignment
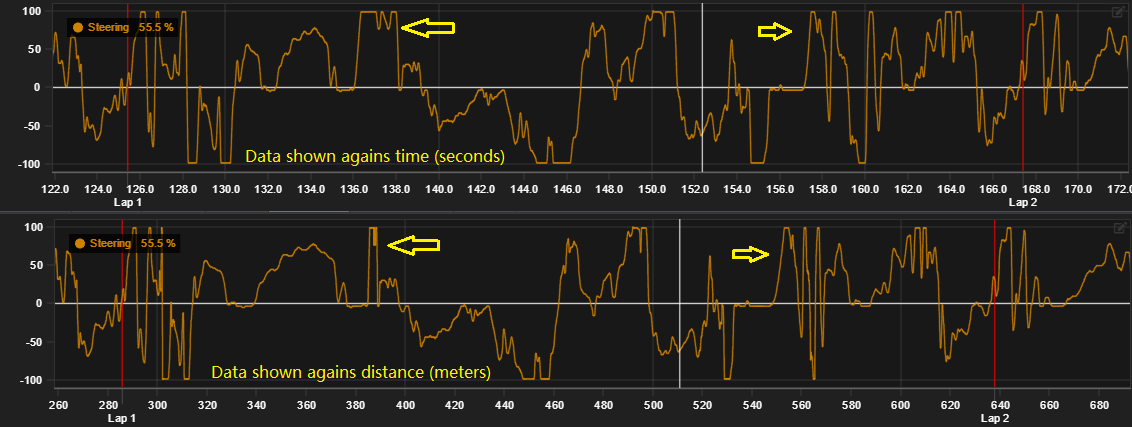
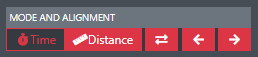
Determine whether data is shown based on funtion of time or function of distance. Note the difference!
Tip
Status bar always shows cursors position with both values.

Left and right Arrows allow offsetting compared lap agains base lap.
Read more about lap comparison in Compare laps.
Zoom
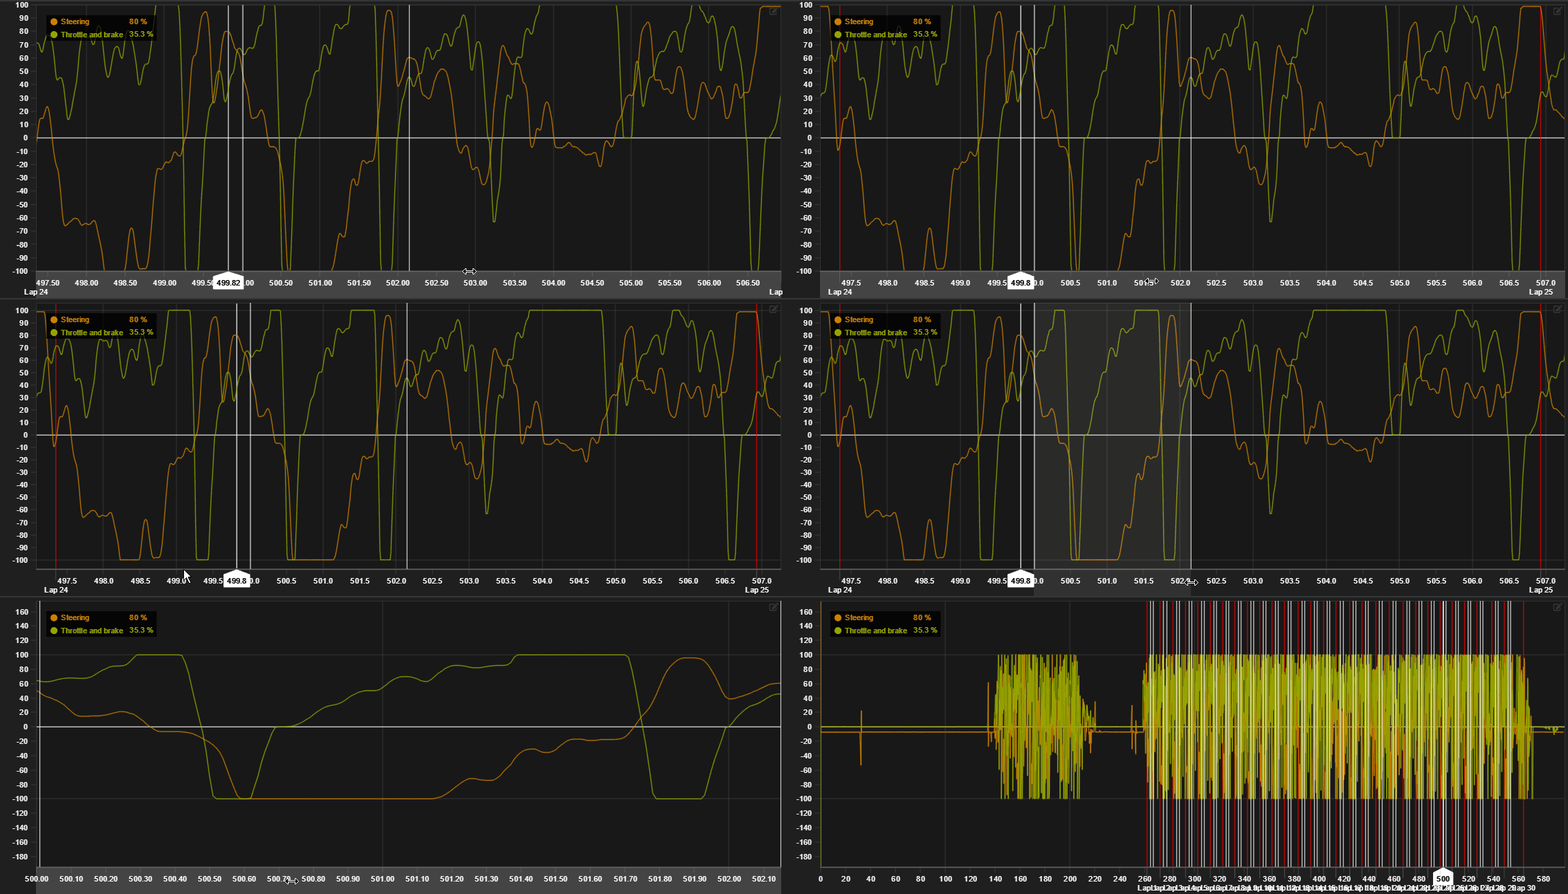
- Use arrow keys or toolbar buttons to zoom
- Zooming can be done from both x-axis and y-axis of chart element by dragging the area you want to zoom
- Double click axis and whole range will be shown
- Mouse wheel can be used to zoom in and zoom out. Mouse cursor needs to be on top of zoomed axis.
- Drag axis with secondary mouse button.
Cursor mode
Analyzer support two data cursor modes. By default cursor in line charts will follow mouse movements and with alternative mode user needs to click primary button of the mouse to place/move the cursor in data.
Cursor mode can be changed from application settings.
Info
Cursor can be dragged with primary mouse button in both cursor modes.
Differences in the cursor behaviour
| Action | Default mode | Alternative mode |
|---|---|---|
| Data cursor to follow mouse | Automatic | Press mouse button while moving mouse |
| Fix cursor to one position | Click mouse button | Click mouse button |
| Release cursor position | Click mouse button | N/A |
Tip
If the default cursor performance is bad, then we recommend switching to the alternative cursor mode from settings.
Tip
Disabling cursor markers improve cursors performance on tabs with multiple line charts.
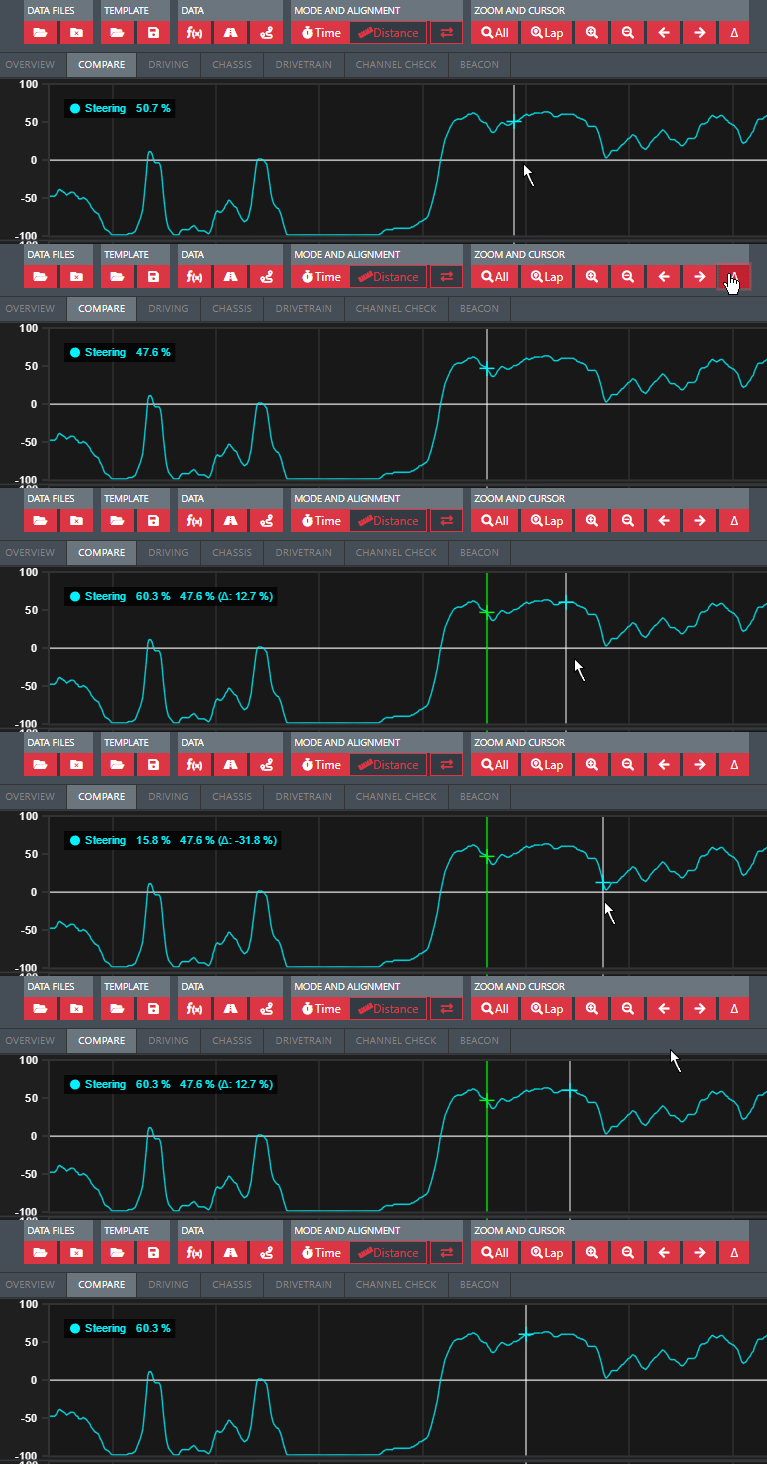
Delta marker
Delta marker allows for comparing selected positions value to cursors value.
Marker is set with toolbar button or alternatively with space hotkey.
Line legends display the cursors value and its difference to the cursors value.
Comparing works for both compared files if present.